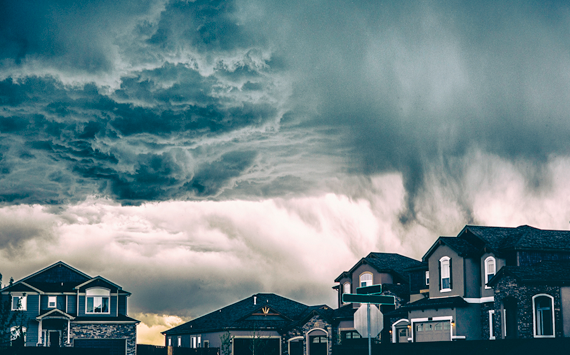
2018 was another tough year for the global property insurance market with a slight year-over-year decline in catastrophe losses, but insurers still paying out for the fourth-highest year ever for disaster events. Globally, more than 11,000 people died or went missing in disaster events in 2018, similar to the number of victims in 2017. For the insurance industry, risks are becoming more cross-border. It’s becoming harder to rely on the data from the past to forecast risk and analyse risk accumulation across markets and lines of business.
From a UK perspective, the year was marked by a long dry spell followed by higher subsidence claims. But it was the big freeze, flooding and windstorms that caused the biggest losses in the UK. Storm Emma and the ‘Beast from the East’ paralysed the country for much of February and March, causing insured losses in hundreds of millions. Eleanor and Friederike, two January windstorms, caused nearly £3 billion losses for Europe overall.
The influence of climate change is becoming more identifiable as extreme weather events are hitting greater geographic areas. UK flood risk has been going in only one direction. The Met Office has logged 17 record-breaking rainfall months since 1910, with nine of them occurring after 2000.
As a consequence, insurance providers have been under prolonged pricing pressure, heightening the need to gain the most detailed view of risk to help ensure policies are priced as accurately as possible.
Mapping for identifying risk accumulations
In commercial property insurance, it is vital that insurance providers are able to understand where their exposures and accumulations lie across their property portfolio. Catastrophic events can have massive consequences for an insurance provider who has found themselves over exposed in one geographic location due to an extreme event such as a flood, fire or an act of terrorism.
As such, all property insurers need a clear picture of their risk accumulation to help guide their underwriting strategies and calculate their exposures at any given time.
Any gaps in understanding the risks presented by a particular property can be filled by data and predictive analytics. Underlining the significant changes occurring in this market, 86% of the insurance providers we surveyed in our regular research* said they believe that data and analytics will transform their business.
Of course the use of perils data is not new to this market. The emergence of perils mapping tools which allow insurance providers to pinpoint the risks associated with specific geographic locations, have played a valuable role in supporting commercial property underwriting.
Mapping tools enable insurance providers to visualise, calculate and underwrite property risks: they can see an address they are insuring, and how that is placed in respect of perils such as flood, subsidence, contaminated land, as well as proximity to other buildings to understand the risk of fire spread or flooding.
Based on the data associated with that address, a risk score provides a simple guide for the level of risk posed by each of the perils which the insurance provider can use at the point of quote or underwriting.
But now, the capabilities offered by these risk management tools are extending not just in the depth of risk understanding but the breadth too.
First looking at the depth of data – appreciating that an address in many cases of commercial insurance can cover a large footprint – one insurance risk score for that address may actually be misleading. Consider a farm, a factory or industrial estate all under one address. A factory covering 1,000 square metres could quite feasibly have a different flood risk at the front of the property to that at the back.
400,000 UK addresses carry unidentified flood risk
As such the next stage in the evolution of mapping systems has been to use building footprint data, using the outline of the building to determine the environmental risks.
In our analysis, 400,000 additional UK addresses were found to have a level of flood risk, based on the building footprint. This knowledge combined with real-time flood alerts direct from the Environment Agency will help put insurance providers in a much more informed position to deliver fair pricing and support customers in a flood event.
In terms of the breadth, mapping tools are now allowing insurance providers to overlay and visualise the geographic spread of their property portfolios enabling them to calculate where risks are accumulating and understand where their exposures could be in an extreme event.
New data layers and risk intelligence methods
New accumulation methods such as LexisNexis Blocks assess the insurer total sum insured in groups of buildings that share a common fire risk. LexisNexis Hot Spots continually trawls the customer’s policy database looking for the highest concentrations of accumulated risks, providing the customer with real-time reporting of their top risk areas.
It is clear that mapping tools such as LexisNexis Map View are becoming much more than just underwriting tools. In time they will allow policy history and other new contributory data to be overlaid with the perils risk data.
This is going to be a huge leap forward leading to new types of risk models, creating new insights to inform every stage of the insurance continuum and helping the commercial property market move towards a more digitised customer journey.
*LexisNexis Risk Solutions carried out an anonymous survey, the UK Insurance Underwriting Digitization Study, 8 December 2016–9 January 2017. Mixed mode of data collection: online panel and telephone interviewing. The sample was 170 insurance professionals, 55 personal motor, 52 personal home and 63 commercial property. The respondent must spend 30% of their time in underwriting-related activities for a given line to be assigned to answer questions specific to that insurance line.
Follow the link to the LexisNexis Risk Solutions website to find out more about how we support insurance providers.