New Data to Deal With Fire Tipping Points for Better Insurance Risk Classification
 In a fire, we know that every minute makes a difference when it comes to saving lives, and that no one can put a price on an injury. For property, however, we can establish fairly accurate tipping points, which give us more context for calculating the insurance risk, and the ensuing cost of claims, with greater precision.
Data enrichment can answer many property challenges for the insurance industry. If we look at flood for example, government-created flood datasets are becoming more detailed. Combined with distance and elevation to the nearest waterbody, for an individual property shown in LexisNexis Map View we can capture 95% of the risk compared to a proprietary flood data vendor. This can be delivered either at point of quote through the LexisNexis Quote Intelligence platform, or as part of the Map View platform. The LexisNexis UK Crime Risk Score used in commercial property risk has been showing its value as a predictor of loss cost. For example we’ve been able to show that a property in the tenth riskiest decile has a 1.39 average loss cost compare to a property in the first or lowest risk decile with average loss cost of 0.79.
But I want to take another peril here, fire, as an example, to show the future possibilities related to location data, as well as some incremental benefits that are available now.
Suppose you are assessing a potential customer who owns a substantial house decorated with an enviable art collection. Do you know what is the maximum time you need to have a firefighter there, before the cost of losses go spiraling up?
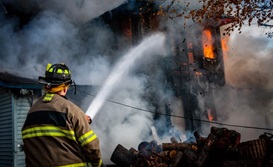
Yes, it is possible to calculate that. The crucial part is for a fire department to respond to a fire before the flashover point. This is a tipping point in a fire where a localised fire becomes so big that it ignites everything in the room that is flammable. If a flashover does occur , all that is left to do usually is to try to control the fire so that it does not spread to neighbouring properties, with the property a total loss. Time to flashover can vary based on construction material and source of fire, but after nine minutes the chance of it occurring is significantly larger than before nine minutes *
Response time to a fire is highly correlated to loss
A fire department’s response time is made up of three components; call handling time, crew turnaround time, and drive time. The first two are relatively consistent in terms of time and variability, with the average in England being three minutes.** This leaves a maximum of six minutes for drive time, which is also the most variable factor in a response time.
Response time to a fire following a 999 call is strongly correlated with loss from a fire. Of particular concern to an insurer are response times that are over nine or ten minutes for an address, due to a combination of call handling time and fire crew turnaround time.
So, how can an insurance provider have access to all this information at point of quote, so as to be sure you are pricing the insurance risk correctly, while offering the necessary protection to your customer? The answer is geo-referenced data, and in particular crossing more and more new aspects of risk data as they relate to the building outline or composition of a specific property.
As LexisNexis Map View clients will know, the overview you want to have, when preparing to insure a property, is similar to a satellite picture. The first thing that comes to mind is to locate the fire stations in the area, and then calculate the time it would take for a fire truck to get to the house. This is the intuitive approach. While it is on the right track, it is not enough. Many factors influence the response time in a fire.
We were able to detail those factors as we developed a truly innovative enhancement for property insurance, Map View Fire Blocks.
To give an idea of the amount of data LexisNexis Risk Solutions has amassed to build the Map View Fire Blocks we collected all the available data from UK fire stations and drive time to over 50 million UK addresses recorded in the UK Address Base Premium and their closest fire stations. In the UK as a whole, according to official figures, there are 1,399 fire-stations. During the process, we took into account the variability in the roads and the number of intersections on route.
In our LexisNexis Risk Solutions analysis, we found out that drive time makes up of 66% of an average fire-station response time, and it is the most variable part of the operation. Other factors are how fast the call is handled and the crew turnaround speed.
It all depends, of course, of how busy the fire station is at the moment of the emergency. It is estimated that 70% of all emergency fire calls are about non-fire incidents, and that 40% of fire calls are false alarms.
To illustrate this point, let me tell you about a 2019 sample we singled out from Nottingham. That year, in the western part of the city, there were over 250 false alarms. This is correlated to the fact that the University of Nottingham is located in the area. The student halls are likely equipped with fire-alarms which automatically alert the fire-station. As a result, every time a student comes home late at night and burns the toast, a firefighter has to attend and turn off the fire-alarm. This also means that if a fire department is already responding to one callout, it would not be available to respond to another incident.
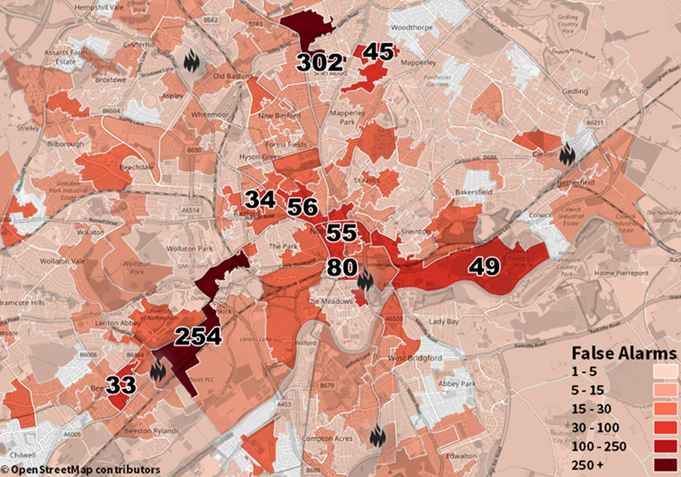
So we take this as an example to show that the data is important in determining insurance risk. But the context and understanding of the data in the insurance domain is also very important.
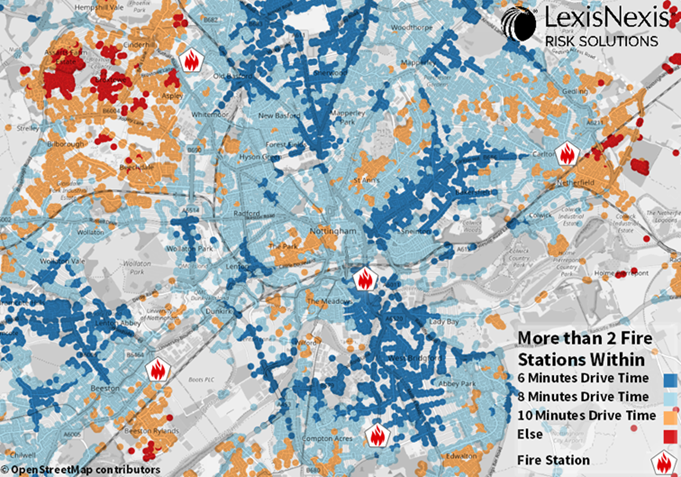
Below is a LexisNexis Map View screen to illustrate properties and fire-stations according to the distance between them. This looks at the drive time from the nearest two fire stations at different cut offs. With dark blue areas having two fire stations within a six minute drive time, this ensures an under-nine minute response even is the closest fire station is busy. The red areas are higher risk, even if they are located very close to one fire station. An insurer writing business in these areas would want to ensure they are taking those risks into account in pricing, or within the policy terms on fire suppression like sprinkler requirements, or considering the total exposure an insurer has within a single building. MapView has been built to provide this information for insurance providers at point of quote in the UK.
Mapping and GIS for a holistic view of insurance risk
The advantages of mapping together the properties, perils and resources to mitigate losses is that you can also analyse your portfolio as a whole and make better decisions on how to leverage what you already have in your books. Map View offers numerous ways clients can harness visualisation to examine insurance risk within any slice of their business, any chosen zone that can be manually drawn, or to examine hidden risk accumulations between different parts of the business.
We have taken all this property data one step further by aggregating them in Map View Fire Blocks. This allows insurance providers to have two levels of granularity.
The first is the primary block, which comprises the property to be insured and its immediate surroundings. The block view provides a good indicator of the risk of fire spreading around. Expanding the focus a bit, we have the secondary blocks, comprising the properties surrounding the primary block. For all blocks, we created a system that allows insurers to visualise the Total Sum Insured (TSI), fire score, claims in the last 12 months and business types, if there is any in the blocks. The figure below gives an idea of how it works.
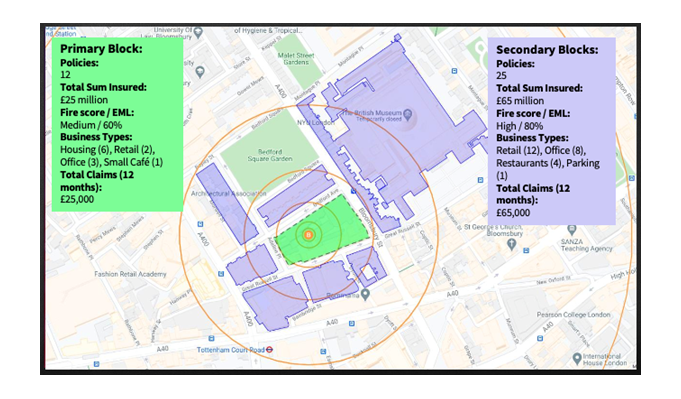
For an accurate TSI, it is necessary to access existing policies, which will be automatically gathered, once Map View is integrated in a company’s system. But even if an individual Fire Block has information gaps, it is still possible to obtain an approximate figure by calculating the TSI in bulk as well.
Having a sum of the policies in a given area allows insurers to better manage their exposures. With LexisNexis Map View, our clients can maintain a data set with all their current policies, and see clearly where they have high accumulations of exposure, or if they are about to exceed authorised accumulation limits.
LexisNexis Map View combined features provide valuable tools for insurers to understand how to manage the risk of fire in their Home and Commercial portfolios down to new levels of detail.
*Fire Brigades Union report: ‘It’s About Time-Why Emergency Response Times Matter to Firefighters and the Public’
** Home Office report: Response Times to Fires Attended by Fire and Rescue Services, England, April 2018 to March 2019
Follow the link to the LexisNexis Risk Solutions website to find out more about how we support insurance providers.